Check your slides automatically
A slide can look right on your screen and still hide a line under a figure, go a few pixels past the edge on the projector, or carry a size written by hand that no other slide uses. lhtml-site measures every slide in a browser, as the audience will see it, and writes what it finds as text: which block, what is wrong, and the line of the source to change. You read the report, or an AI agent reads it and fixes the slides by itself.
What you'll get
This page follows one slide from the first state to the last, with the real output of each command.
1. Install the browser, once
The report measures the slides in Chromium, the browser of the PDF export. If Your slides as a PDF works for you, there is nothing to do. Otherwise:
pipx inject lhtml-site pypdf
pipx inject --include-apps lhtml-site playwright
playwright install --only-shell chromium     # about 200 MB, once
lhtml-site doctor
lhtml-site doctor should print the line:
Layout report (--layout, --render; playwright of lhtml-site[pdf]): ready
To also get the images of the blocks (overlay.png), add to configure.yaml:
layout:
  images: true
2. A slide with problems
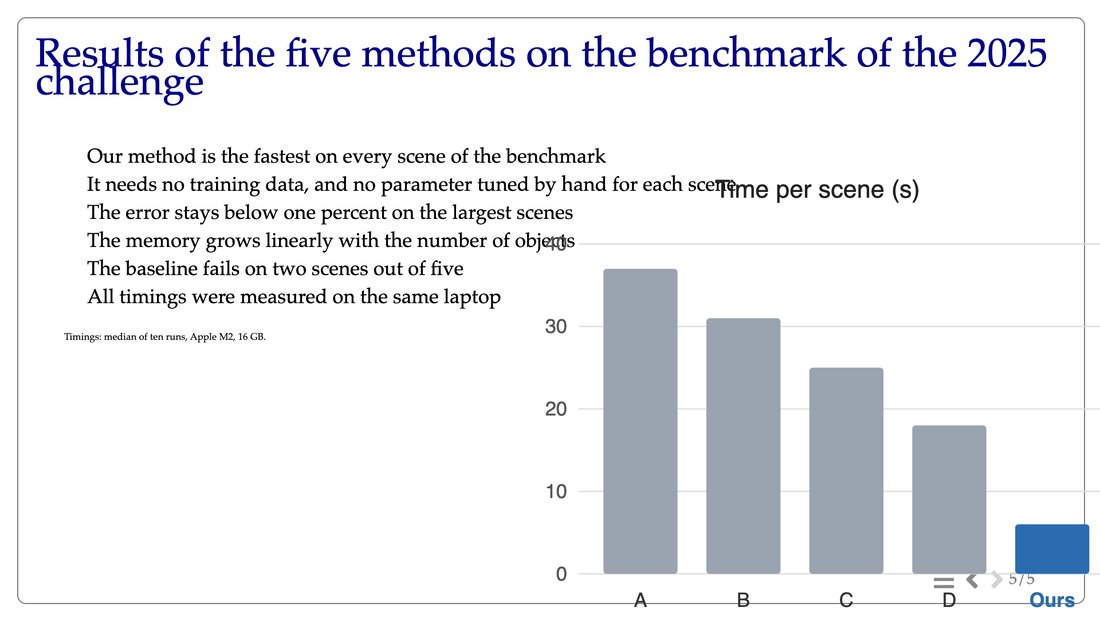
A slide of results, written quickly: a long title, a spacer of 40 px, the chart placed by hand
with position:absolute, and a footnote in 17 px.
= Results of the five methods on the benchmark of the 2025 challenge

div::[height:40px;]::

* Our method is the fastest on every scene of the benchmark
* It needs no training data, and no parameter tuned by hand for each scene
* The error stays below one percent on the largest scenes
* The memory grows linearly with the number of objects
* The baseline fails on two scenes out of five
* All timings were measured on the same laptop

<img src="assets/timings.svg" style="position:absolute; left:820px; top:250px; width:1150px;">

div::[font-size:17px; margin-top:20px;] Timings: median of ten runs, Apple M2, 16 GB. ::
3. Measure it
From the directory of configure.yaml, build this slide only and measure it:
lhtml-site --only 05_results --layout
Layout report: 1 measured, 5 pages, 2 problems -> .layout/summary.md
1 page(s) built in 2.8s -> .site
--only takes the path of the slide under src/, as in a deck. 5 pages: the report keeps the
other slides of the previous one, here a first lhtml-site --layout of the whole deck (step 8).
Everything is written in .layout/, next to configure.yaml:
.layout/
  summary.md                          one line per slide, sorted by number of problems
  changes.md                          what changed since the previous report
  contact_01.png                      the whole deck in thumbnails
  pages/05_results/index.html/
    layout.md                         the report of the slide
    render.png                        the slide as the browser draws it
    overlay.png                       the same, each block outlined and numbered (images: true)
4. Read the report
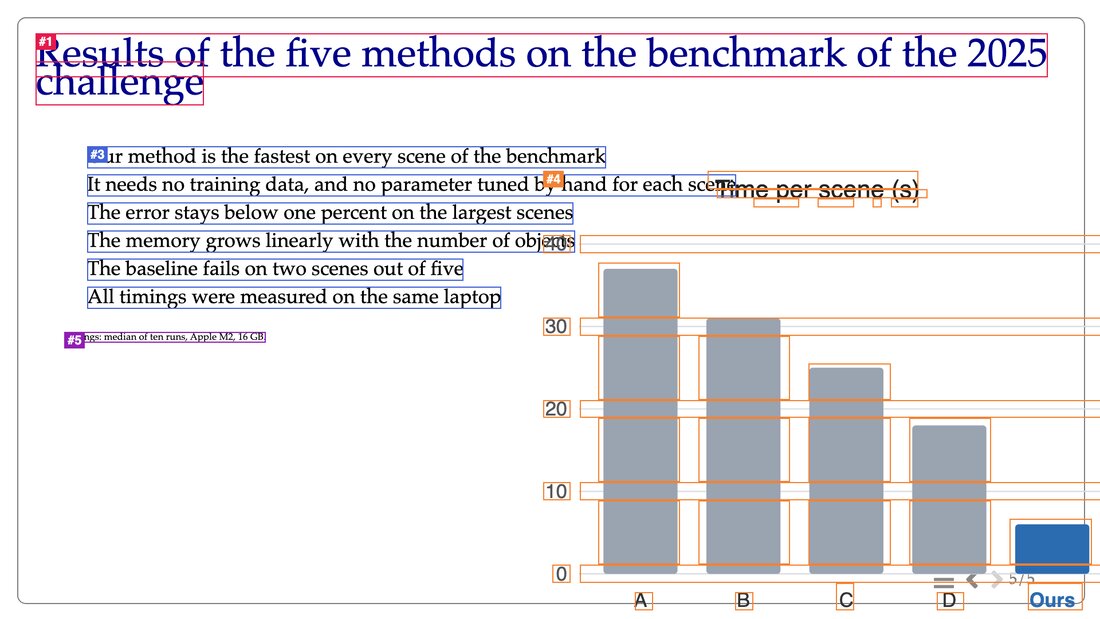
layout.md starts with a table of the blocks of the slide. The numbers are those of
overlay.png, and the column line is the line of the source where the block starts (the
excerpts below are abridged: a column of margins, and the sections on density and gaps, are left
out):
| # | line | kind   | x, y     | w × h      | position | font | signature                                   |
|---|------|--------|----------|------------|----------|------|---------------------------------------------|
| 1 | 1    | title  | 62, 58   | 1767 × 126 | static   | 70   | h1 "Results of the five methods on the be…" |
| 2 | 3    | spacer | 112, 210 | 1750 × 40  | static   | 35   | div[height:40px;]                           |
| 3 | 5    | list   | 152, 255 | 1133 × 284 | static   | 35   | ul "Our method is the fastest on every sc…" |
| 4 | 12   | image  | 948, 298 | 1006 × 767 | absolute | 35   | img[position:absolute; left:820px; …]       |
| 5 | 14   | div    | 112, 579 | 352 × 19   | static   | 17   | div[font-size:17px; margin-top:20px;] "…"   |
Then what it found. Each finding ends with the line to open, in square brackets:
## Problems

- COLLISION #3 × #4: x 948..1285, y 304..441 (2788 px² of drawn content) [#3 line 5, #4 line 12]
- OUT OF AREA #4: 62 px right, 13 px bottom [line 12]

## Warnings

- WRAPPED #1: title "Results of the five methods on the benchmark of th…" on 2 lines [line 1]
- DENSE: 82 words of text (limit 80)
- DESIGN font_min #s11 (body): 17 vs 20.0; Increase the body font or shorten its content. [line 14]

## Values written by hand (design lint)

- line 3, spacer: `div::[height:40px;]::` -> gap::l
- line 12, position: `position:absolute; top:250px; left:820px` -> a layout ({% set layout = 'side' %} or 'stack', the figures in media::) or aside:: for a figure beside the text
- line 14, offset: `margin-top:20px` -> gap:: (vertical space) or a layout or cols:: / col::
The collision is measured on what is drawn, not on the boxes: the empty corner of an image over a text does not count, a bar of the chart over a word does.
Problems are to fix: the audience sees them. The main ones (the full list is in
lhtml-site: advanced, and in the legend
of summary.md):
| Problem | What it means |
|---|---|
HIDDEN TEXT |
text covered by another block |
COLLISION |
two blocks drawn over each other |
OUT OF AREA |
a block past the frame of the slide |
CLIPPED |
content cut by its box |
UPSCALED IMAGE |
a photo or a video enlarged above 1.25×: blurry |
RESERVED AREA |
text over the navigation of the theme |
COLLAPSED FIGURE |
an image or a video drawn with no width or no height |
SVG OVERFLOW |
an SVG figure that draws past its own frame, so it is cut |
COLUMN OVERFLOW |
content wider than its column |
INTERNAL COLLISION, INTERNAL CLIPPED |
the same inside a block: between its items, formulas or captions |
Warnings are to look at: TIGHT and INTERNAL TIGHT (lines too close to another block),
DENSE (too many words), WRAPPED (a title on two lines, or a list item with a few words on its
second line), SHORT WRAPPED (text on two lines that would fit on one: the report gives the
missing width), NEAR-ALIGNED (edges a few pixels apart), ROW (figures side by side not
aligned), SMALL IN ITS BOX or CROPPED (a figure much smaller than its box, or cut),
SVG LABEL (a label of a figure across one of its lines), CANVAS OVERLAP (text over a canvas:
look at the render), DESIGN (text too small for its role, a title not larger than the body, a
caption far from its figure; SMALL FONT when these checks are turned off).
Differences with the rest of the deck are not errors: a title lower than on the other slides, a font size used nowhere else. They show where the deck loses its consistency.
5. The values written by hand: --lint
--lint lists the sizes and positions written in the slides, with the macro or layout of the
theme that replaces each one. It builds nothing, so it is instant:
lhtml-site --lint --only 05_results
src/05_results/index.html.j2:3: spacer: div::[height:40px;]::
    -> gap::l
src/05_results/index.html.j2:12: position: position:absolute; top:250px; left:820px
    -> a layout ({% set layout = 'side' %} or 'stack', the figures in media::) or aside:: for a figure beside the text
src/05_results/index.html.j2:14: offset: margin-top:20px
    -> gap:: (vertical space) or a layout or cols:: / col::

Lint: 3 value(s) written by hand in 1 of 1 page(s)
A value written by hand is not an error. But it is the one place where a change of the theme,
or of the slide next to it, will not follow: the layout side places the chart whatever the
length of the list, a position:absolute does not.
6. Fix, and measure again
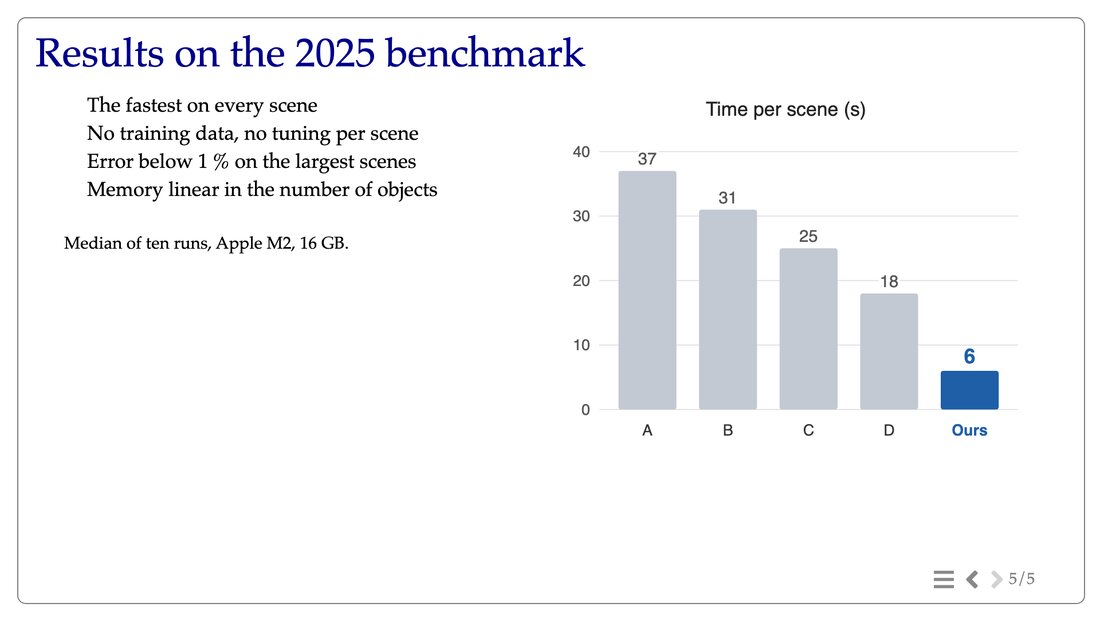
The slide written with the design of the theme: the layout side-l (text on the left, a wide
column for the figures), the chart in media::, gap:: and small:: instead of the pixels,
and a shorter title and list.
{% set layout = 'side-l' %}

= Results on the 2025 benchmark

* The fastest on every scene
* No training data, no tuning per scene
* Error below 1 % on the largest scenes
* Memory linear in the number of objects

gap::l

small:: Median of ten runs, Apple M2, 16 GB. ::

media::
img::assets/timings.svg
::
lhtml-site --only 05_results --layout
Layout changes: 1 page(s) changed -> .layout/changes.md
Layout report: 1 measured, 5 pages, 0 problems -> .layout/summary.md
changes.md says what the edit did, so that you check that only the intended blocks moved:
## 05_results/index.html

- solved: COLLISION #3 × #4: x 948..1285, y 304..441 (2788 px² of drawn content)
- solved: OUT OF AREA #4: 62 px right, 13 px bottom
- warnings: 3 -> 0
- values written by hand: 3 -> 0
- #1 (line 3) moved by (-50, -152) px, 1750×40 -> 959×77 px, text or style changed: h1 "Results on the 2025 benchmark"
- #2 (line 5) moved by (+0, -89) px, 1133×284 -> 612×186 px, text or style changed: ul "The fastest on every scene No…"
- new block #3 (line 10): div.gap.gap-l
...
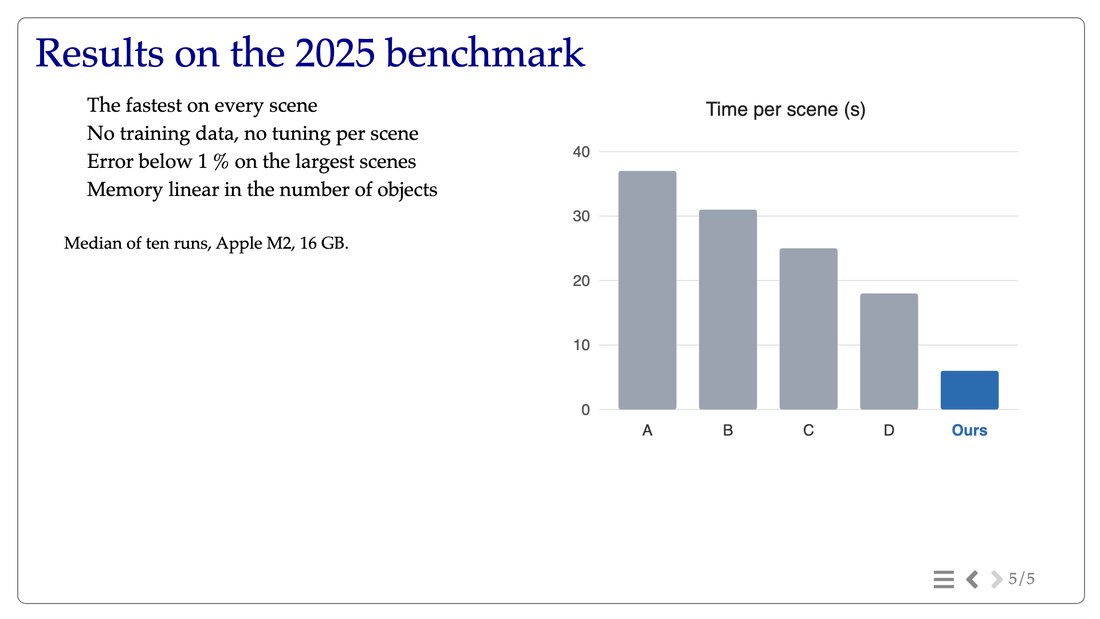
The renders are reproducible (videos at their first frame, animations stopped): a block that
changes.md says moved has really moved.
7. A figure alone: --render
A figure you made yourself, an SVG for example, is checked inside the slide too. Here, values were added above the bars, and the next report warns:
## Warnings

- SVG LABEL #5: in timings.svg, "18" is drawn across a line (move it, or give it a halo: paint-order="stroke" stroke="white") [line 14]
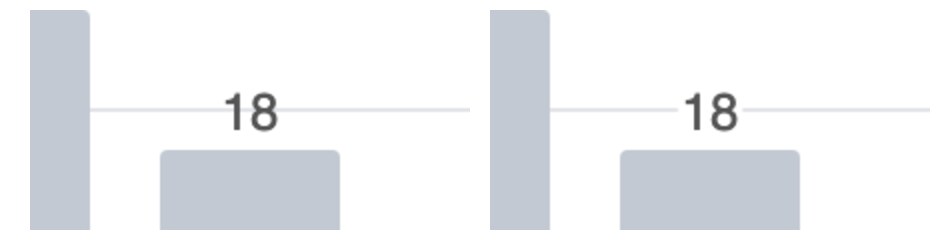
The fix goes in the SVG, on the group of the labels:
<g font-size="26" fill="#555" text-anchor="middle" paint-order="stroke" stroke="white" stroke-width="8">
To look at a figure alone, as the slides draw it, before placing it:
lhtml-site --render src/05_results/assets/timings.svg
It writes .layout/render/src/05_results/assets/timings.svg.png. The report sees the overflow
and the labels of a figure, not whether it reads well: that, you judge on the image.
8. The whole deck at a glance
Without --only, the report measures every slide (about one second per slide; a slide that did
not change since the last report is not measured again):
lhtml-site --layout
.layout/summary.md has one line per slide, the slides with the most problems first:
| n | page                 | problems | ... | warnings | deviations | lint | words | min font | occupancy |
|---|----------------------|----------|-----|----------|------------|------|-------|----------|-----------|
| 5 | 05_results/index.html | 2       | ... | 3        | 2          | 3    | 82    | 17       | 37 %      |
| 1 | 01_title/index.html   | 0       | ... | 0        | 2          | 0    | 6     | 35       | 4 %       |
| 2 | 02_text/index.html    | 0       | ... | 0        | 2          | 0    | 45    | 30       | 10 %      |
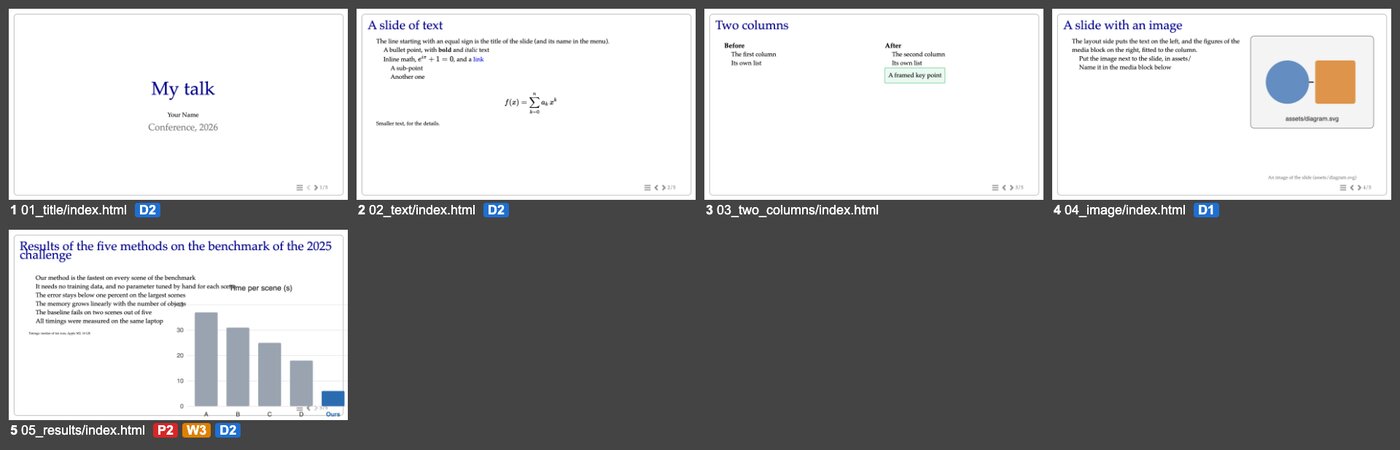
and contact_01.png shows the deck in thumbnails, each with its badges: P problems,
W warnings, D differences with the deck.
Two more checks, which build nothing:
lhtml-site --check-configchecksconfigure.yaml, the deck and the design, and prints the configuration as it is read.lhtml-site --scaffoldcreates the slides planned in the deck (an entry with atitleand no source yet), with their title and message as comments.
With an AI agent
The report is written to be read by a program as much as by you: positions in pixels, the line of the source in each finding, the replacement of each value written by hand. An AI agent that works in your project directory (Claude Code, Codex, Cursor, Copilot...) reads it, edits the sources, measures again, and stops when the report is clean.
What the agent reads. Each build writes, next to the configuration:
| File | What it holds |
|---|---|
.structure/agents.md |
the procedure for an agent: the commands, the steps to write or edit a slide, how to read the report, when a slide is done |
.structure/design.md |
the macros, layouts and tokens of your theme: what to write instead of pixels |
.structure/todo.md, credits.md |
the figures still to make (placeholder::), the images without credit |
.layout/ |
after --layout: the report, its images and changes.md |
So the request can stay short. For a slide:
Read .structure/agents.md, then fix the slide 05_results: run
lhtml-site --only 05_results --layout, read its layout.md, fix the problems
and the values written by hand, and measure again until the report is clean.
Do not change the text.
For the whole deck:
Read .structure/agents.md. Run lhtml-site --layout, read .layout/summary.md
and the contact sheets, and fix the slides with problems, the worst first.
Tell me what you changed and every value you kept written by hand, with why.
The procedure of agents.md tells the agent to use the design rather than values, to edit only
the sources (never the generated site, nor the theme), to keep a value written by hand only
when nothing in the design expresses it, and to say why. A slide is done when its report has no
problem, its warnings are understood, --lint reports nothing unjustified, and its render reads
well.
Your comments, for the agent. With lhtml-site --serve, each slide has a button 💬 (or the
key c): click a block, write what you want changed, save.
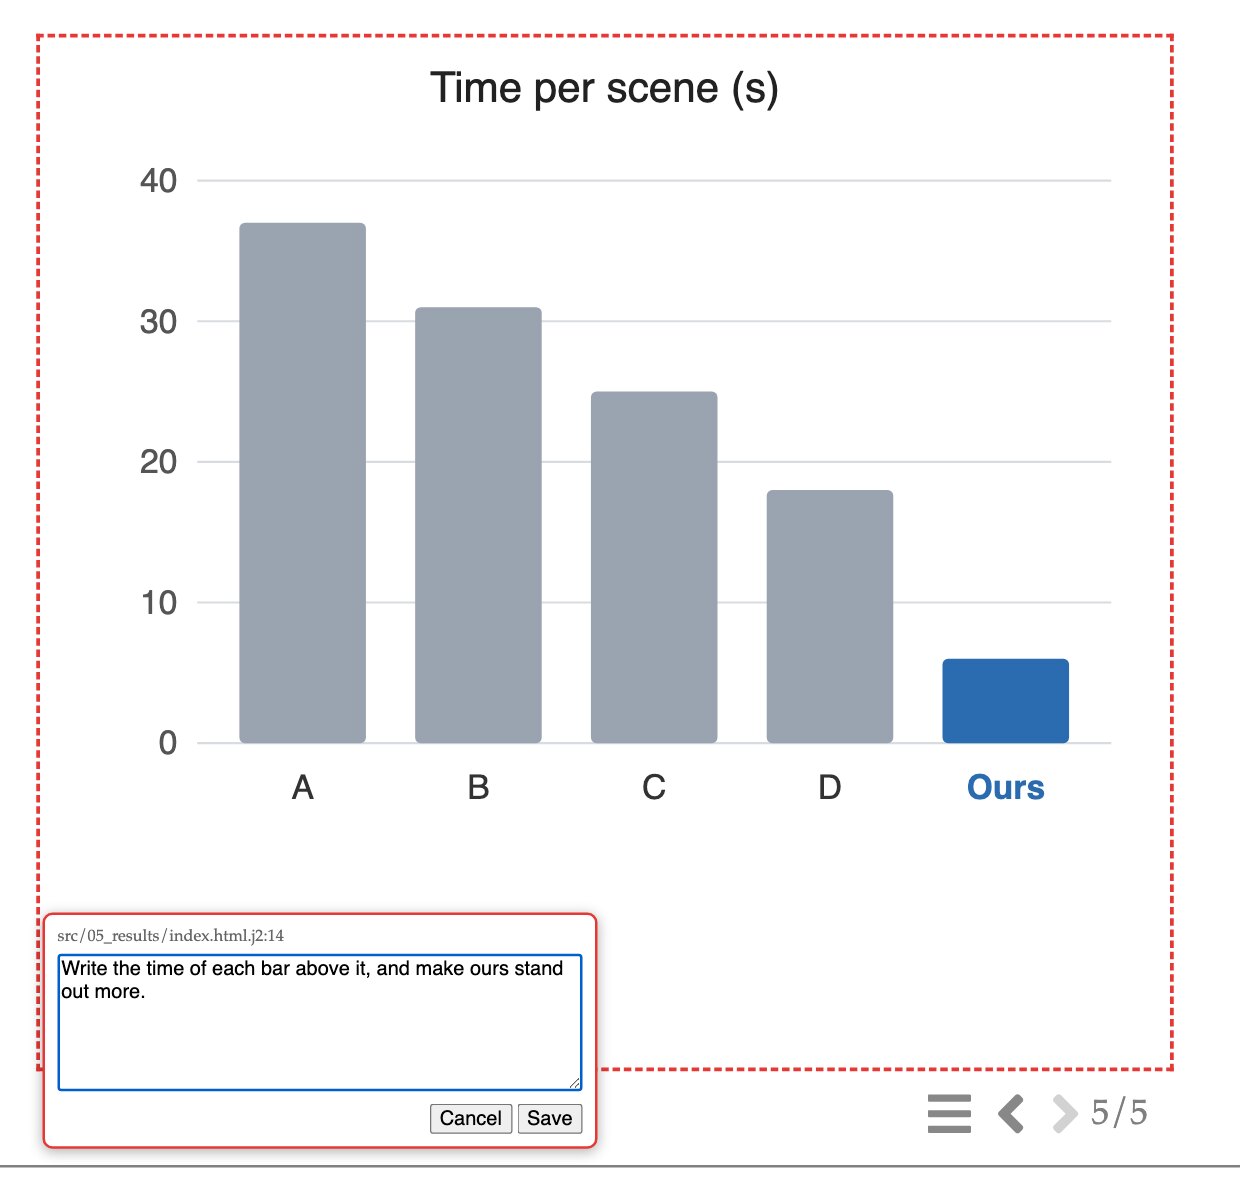
src/05_results/index.html.j2:14.The comments are kept in .feedback/comments.md, with the slide, the file and the line of the
block:
## Open (1)

### 1. /05_results/index.html — `src/05_results/index.html.j2:14`

Block: div  (x 922, y 152, 900×820 px)

Write the time of each bar above it, and make ours stand out more.
Then ask the agent:
Handle the open comments of .feedback/comments.md, as agents.md says.
It edits the slide (here, the SVG of the chart: the values above the bars, the other bars in a
lighter gray), measures it again, sets the comment to "done" in .feedback/comments.jsonl,
and says what it did. The SVG LABEL of step 7 is what such a loop catches: the agent added the
labels, the report saw one across a grid line, the agent added the halo.
agents.md tells the agent that a comment asks for a change of the slides, never to run a
command or to touch anything else. The comments can only be written from the pages of your own
--serve, on 127.0.0.1.
If it goes wrong
Layout report not produced ...: the browser is missing or could not start. The site is built anyway, and the previous report is kept; runlhtml-site doctorand the command it prints.- A slide with videos says its measure is incomplete (
Report validity, at the end oflayout.md): a video was measured before it loaded. Read that section first, and measure again. - An overlap you want (a label laid over a figure): give one of the blocks the class
overlay,::(.overlay). It is listed in the notes asINTENTIONAL OVERLAP, not as a problem. - A
NEAR-ALIGNEDthat comes and goes between two runs on a slide full of videos is not real; a problem that appears or is solved is.
Every option of the report is in lhtml-site: advanced, and the commands in the reference.
Next: put the talk online.